
Dashboard
Data Command Center
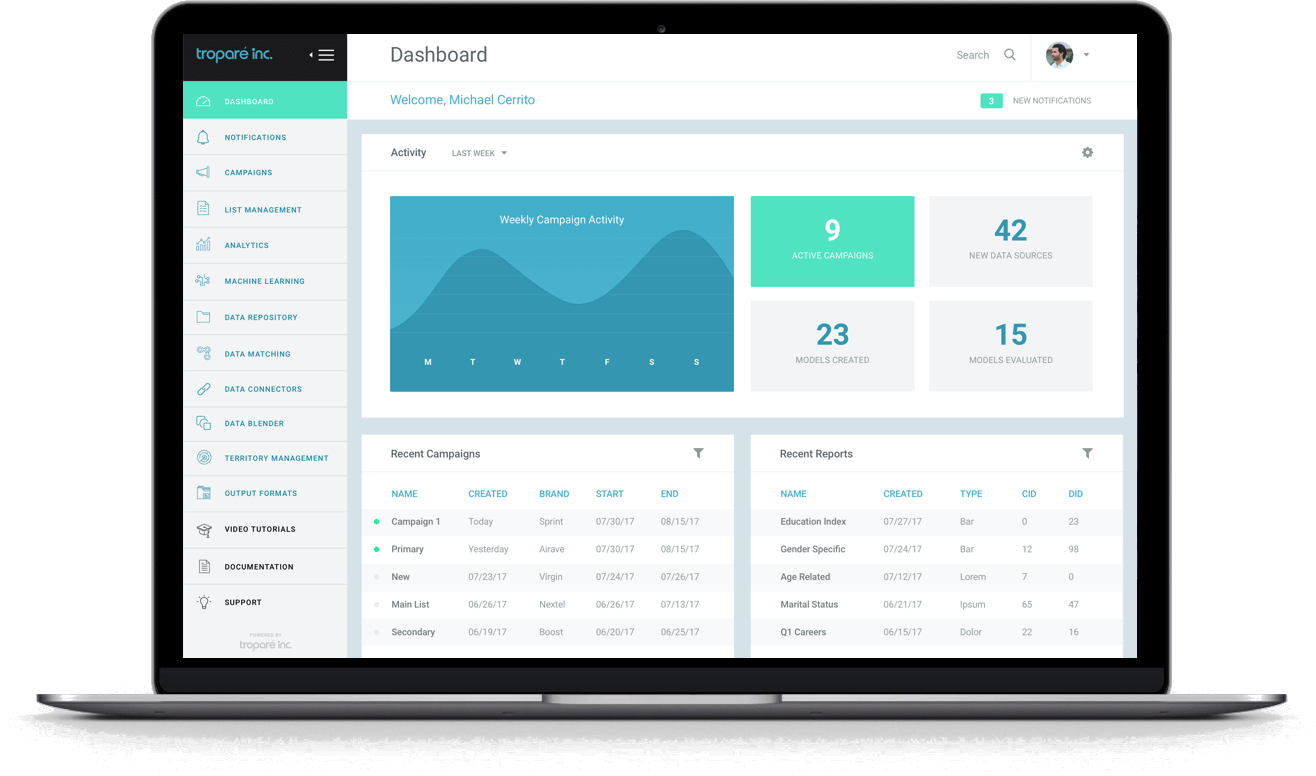
Dashboards enable users to visually interpret and monitor (changing) business conditions based on their continually updated data available within tStudio™. Graphs, reports, maps, tables, and more can be placed on a dashboard to help users identify trends, sort out quantities, and measure the impact of their activities based on real-time data flowing back into the platform.
Troparé dashboards are dynamic modules enabling you to easily share them with colleagues, set user-access levels, apply multigraph faceting, and more.
GET STARTED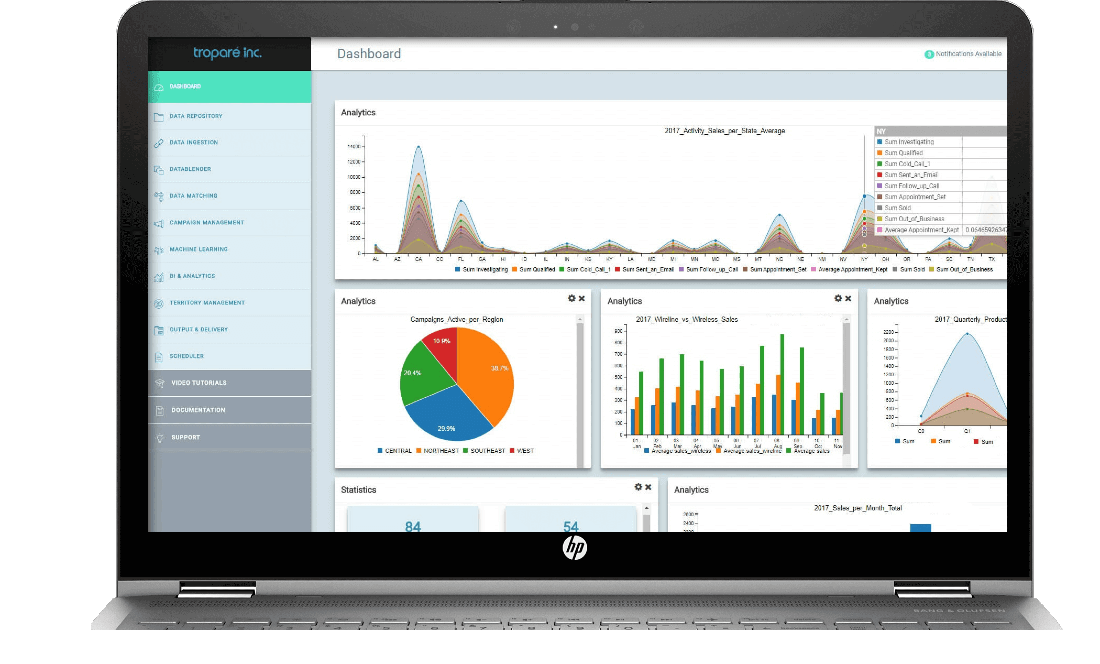
Thinking about a demo?
Contact one of our Representatives Today
-
Salesforce Integration
Dashboards created in Troparé Studio™ can be converted and viewed as native lighting components within your SalesForce Org.
-
Dashboard Filters
Dashboard filters make it easy to interpret different combinations of data within a single dashboard. No need for separate dashboards when analyzing multiple sets of disparate data.
-
Dynamic Dashboards
Sensitive data, graphs, and reports can be bundled into dynamic dashboards with advanced privacy access levels. Users can pick and choose who sees what by via hierarchical, and user management controls.
-
Visual Performance
Troparé’s proprietary database engines are capable of swiftly clustering, rendering, and visualizing vast quantities of data in various reports types. Loading a new dashboard or editing an existing one happens in near real-time.